IAP Revenue Distribution
Use our IAP Revenue Distribution tool to identify offers that generate the most value and to compare ways in which competitors structure their monetization.
— Maria Bolshman

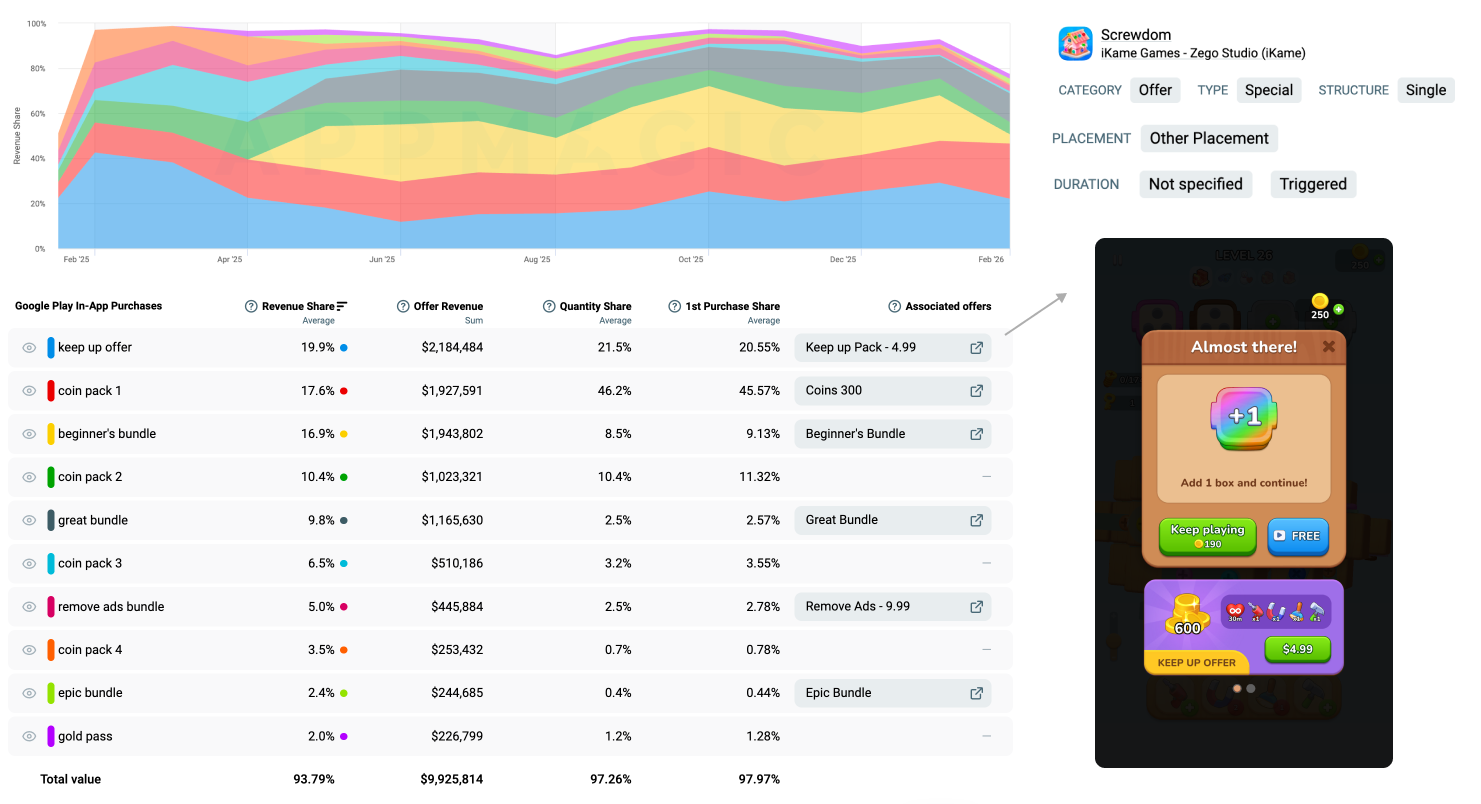
IAP Revenue Distribution shows how revenue from in-app purchases is distributed between individual offers on both Google Play and the App Store. Instead of looking at total IAP revenue, you can see which SKUs (unique offer IDs) generate the largest share of earnings, which ones are bought most often, and how spending is structured inside a game or app.
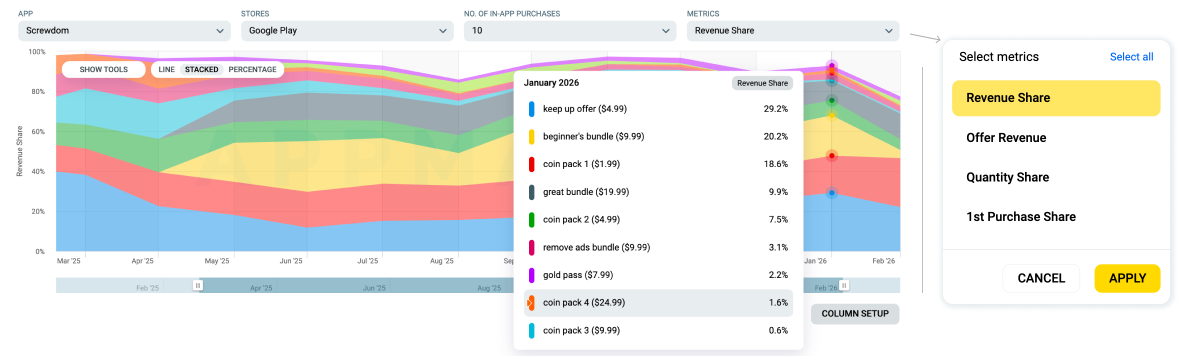
The tool gives you offer-level visibility of competitor monetization. Filter by app, store, and time period to view up to 20 top-performing offers ranked by their revenue contribution.
You can find the IAP Revenue Distribution under Product Insights
Each offer can be studied from the following angles:
• Price: offer’s current price.
• Offer Revenue: estimated revenue that the selected offer contributed.
• Revenue Share: the percentage of total IAP revenue generated by the offer.
• Quantity Share: the percentage of total purchases attributed to the offer.
• 1st Purchase Share: the share of first purchases that go to the offer.
• Associated Offers: with Monetization Intelligence integration, the tool allows you to quickly obtain offer screenshots and tags.
In rare cases, the same offer ID may appear with multiple price points. Each price point is displayed separately, and SKU rankings depend on the time period you select.
Why Offer-Level Visibility Matters
Total revenue only tells you how much an app earns, but not how exactly it is generated. With offer-level visibility, you can see whether a project relies on one dominant SKU or spreads revenue across multiple tiers. You can compare purchase frequency across price points and understand how monetization is structured within the game.
This helps answer questions like:
• Which offers generate the largest share of revenue?
• Which offers are purchased most frequently?
• Are high-frequency purchases also high-value?
• What price levels consistently perform in this genre?
It also helps track the evolution of a developer’s monetization strategy over time. By comparing offers across different periods, teams can spot which bundles or deals increase purchase frequency, shift revenue distribution, or drive more first-time purchases.
Without this feature, teams rely on assumptions, internal data, or surface-level rankings. There’s no structured way to benchmark how revenue is distributed across offers in competing apps. And this metric fills that gap.
Many of these offers can also be explored in more detail through the integrated Monetization Intelligence view, where you can see how they appear in the game and what triggers them.
Where Does the Data Come From?
The metric is currently available for the US market only. The data is based on real purchase data from US users and covers around 1,000 top-grossing gaming and non-gaming apps across major subgenres.
Unlike most public rankings based only on App Store listings, IAP Revenue Distribution also includes data on Google Play purchases. This helps teams compare how the same game monetizes across stores and pin down differences in player behavior and spending.
A few important details about the data:
• Data is available weekly or monthly, which helps capture stable monetization patterns
• Updates typically arrive with a delay of up to two weeks needed to validate the data
• Non-gaming apps usually show fewer offers, as subscriptions dominate their monetization
Who Benefits Most?
IAP Revenue Distribution is designed for mobile apps monetizing through in-app purchases, both gaming and non-gaming. It is most useful for:
• Product and monetization teams seeking to refine pricing and bundles
• LiveOps and economy managers balancing in-game economies
• Analysts benchmarking competitors and revenue structure
For all these teams, it boils down to the same thing: what actually drives IAP revenue. Revenue doesn’t come from IAPs as a category. It comes from specific offers at specific price points. IAP Revenue Distribution helps you understand how that revenue is actually built.