The Essentials of Using AppMagic for Mobile Market Analysis
A practical guide to AppMagic’s core metrics, their methodology and accuracy, and the key features available on out plarform.
— Lera Kalashnikova and Andrei Zubov

Metrics
Revenue
The app revenue we display is the net revenue from IAP earnings based on transactions made via mobile app stores. These estimates exclude platform fees and include taxes. We do not track ad revenue.
RpD
AppMagic users benefit from using our proprietary app metric: revenue per download (RpD), which is effectively a revenue-to-downloads ratio. Understanding it correctly is crucial! This metric is essentially a rather decent approximation of an app’s LTV when considered over its entire lifetime—that is, as long as the amount of time that has passed since the app’s worldwide launch is considerably greater than its average user lifetime. Typically, it implies six months or more since the app’s global launch.
In other words, if it has been more than half a year since the app went worldwide, you can treat its RpD as LTV. That said, interpreting global RpD figures is not the best use case, since RpD is highly dependent on traffic sources. It makes sense to analyze an app’s RpD by country and platform, as this provides a good indication of the CPI that the publisher can afford to pay in each country.
Remember to stay somewhat skeptical about an app’s RpD value if the number of downloads it generates is less than 30K per month.
Featuring Score
There is another metric unique to AppMagic: the Featuring Score. It allows you to benchmark the power of support (i.e., the impact of featuring placements) that your and your competitors’ apps receive. Similarly, it can be treated as an indicator of one’s chances to obtain notable featuring support for a game of a specific genre.
We calculate our Featuring Score by measuring the average downloads boost resulting from each type of featuring placement and combining it with data on the app’s average RpD by country and platform, all adjusted for the length of the featuring period (since its effect fades over time).
👉 For example, if a game gets featured on the App Store’s front page in the US for a week, the Featuring Score will reflect how many extra downloads and how much additional revenue this placement typically generates compared to when not being featured.
Retention
We start displaying Retention in a week after an app’s release—as long as it clocks in at least 1,000 downloads per week. From that point on, we continue to track this app’s Retention even if its downloads drop because mature apps typically exhibit stable user behavior.
We base our Retention estimates on data from a panel app with 30M monthly active users. When direct data is unavailable, we use a mix of benchmarks and heuristics, including app store rankings and performance percentiles by subcategory, data shared by clients, insights from each app’s actual behavior, such as revenue trends, download patterns, RpD, and featuring score. All of this feeds into a refined model that helps estimate user behavior as accurately as possible.
DAU/MAU
We calculate our DAU and MAU estimates based on data from a panel app with 30M monthly active users. When direct data is unavailable, we use the same mix of benchmarks and heuristics as we do for Retention (see previous block).
Accuracy Of Data
Generally speaking, when discussing the accuracy of data in mobile market research tools, we refer to the accuracy of estimates of revenue and downloads, which varies.
In most cases, the accuracy is pretty good: the average monthly discrepancy is about 10%. Our revenue and downloads data is updated daily, with previous-day figures processed between 12:00 AM and 2:00 AM CET. After each update, there may be minor shifts in the charts; while top positions change very little, apps in the middle range or lower usually move by no more than the same 10%.
However, when it comes to low figures for revenue and downloads, it's very hard to stay accurate. The reason is that we build our estimations based on app rankings in mobile app stores across every country and platform. The Top Grossing chart provides information about app revenue, while the Top Free chart reflects downloads.
Each app may be ranked in more than one category, e.g., Overall/Games/Strategy. If an app slips out of the top charts in all categories in a subset of countries, we will have zero information about its metrics in these countries. As a result, we will underestimate the metrics of this app from a worldwide perspective.
When it comes to top positions in the charts, dispersion in possible values can be very high. For example, the revenues of apps No. 1 and No. 2 may be equal one day but stand five times apart from one another the next day. However, these apps will maintain their positions in the rankings.
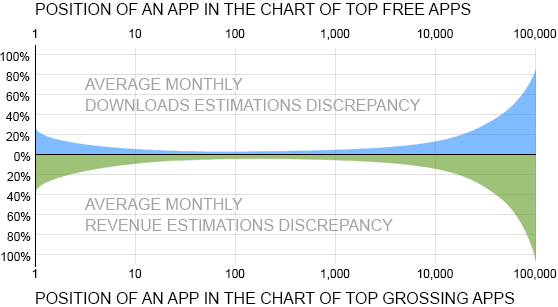
Many smaller apps appear briefly—or only in a few countries—and then disappear from the rankings. Since top charts only include a limited number of apps, those making less than ~$10K per month or getting fewer than 1,000 downloads a day might not show up at all. This causes considerable uncertainty.
In essence, we recommend taking estimates for revenue and downloads for low-performing apps (those with fewer than 30K downloads or $30K in revenue per month) with a good grain of salt. As for the apps that generate less than $10K in revenue or 10K downloads per month, the estimates are hardly reliable. The better the app’s performance, the higher the accuracy of estimates.
We process the 74 largest economies (countries) in the world in terms of GDP. In general, this accounts for approximately 97% of global revenue and 90% of global downloads. However, if an app is mostly popular in smaller countries (such as those in the Middle East or Eastern Europe), the discrepancy may turn out to be quite large.
So, what do we do to improve the accuracy of our calculations? Some companies partner with us by securely sharing their data. This information is never displayed on the platform—it’s used only to train and improve our model. With each additional dataset, accuracy grows and the margin of error shrinks, so the insights you get from AppMagic are as clear and reliable as possible.
App Tags
One of the most valuable and distinct features of AppMagic is its very detailed classification of apps. The classification is done manually. Every day, our specialists review all the apps that have made it to the top charts and tag all the newcomers by genre, setting, and art style. As of today, we have classified more than 380,000 apps.
The tags are accessible via many of AppMagic’s tools, allowing you to easily address a market niche of interest and conduct niche research in mere seconds. For example, you can find all recently released FPS games that have managed to hit the top charts and compare their performance on a single dashboard.
How Our Features Work
💡 *You can read up on nearly every feature from our Tips in the bottom-right corner. There, you’ll also find step-by-step video guides to help you get the most out of each tool.*
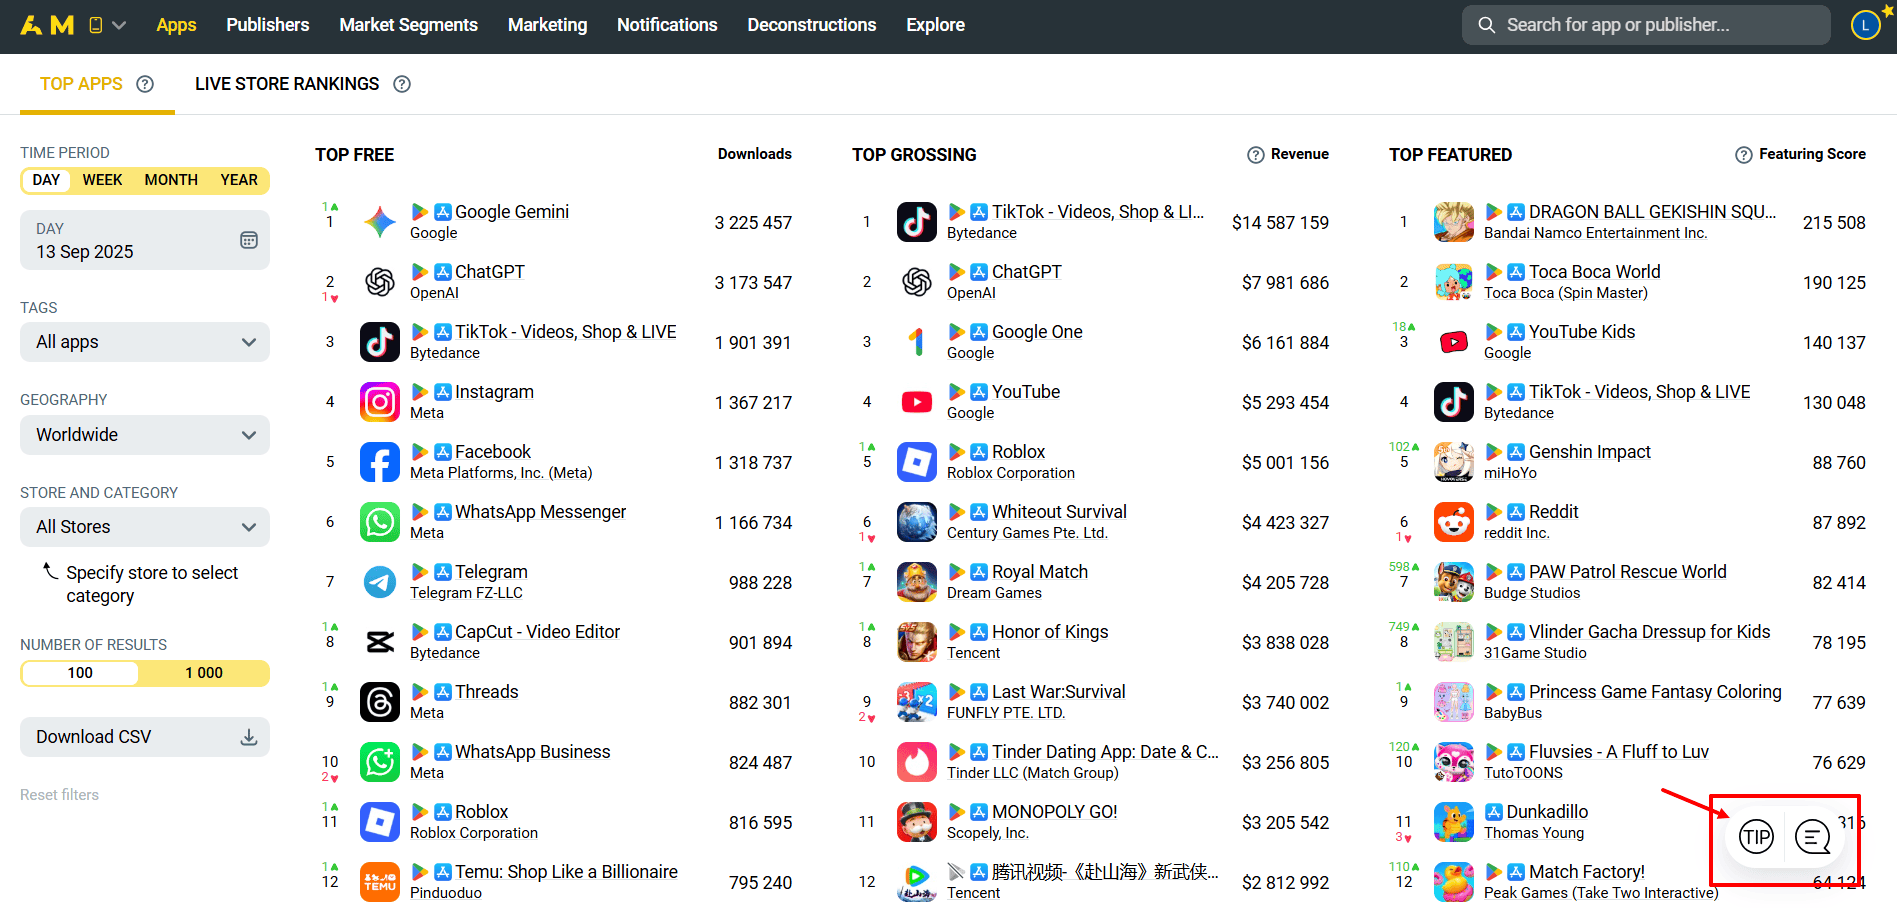
Meanwhile, please find a few useful tool descriptions below to walk you through the platform.
Period Comparison
With Period Comparison, you get clear, accurate growth metrics for your segment and its leading titles—by revenue, downloads, DAU, and MAU—period over period. For example, choose Q2 2025 to compare it with Q1 2025, H1 2025 to view the trends against H2 2024, or any month versus the one immediately preceding it.
In fact, specify any period you want, including just a few days, and the tool will benchmark it against the previous one of equal length.
Advanced Search
This tool is one of the fastest ways to find exactly what you need, using flexible filters to narrow your search. Instead of manually browsing through countless games, you can instantly filter by revenue, DAU, subgenre, publisher HQ location, production complexity, user ratings by country and store, and more.
The built-in Keyword Search takes it further, allowing you to find any keyword in app titles and app descriptions in the stores—or even combine two keywords at once, making it easy to track specific themes or market trends. For example, if you want to spot apps riding trends like Squid Game, Twilight, or no wifi, simply enter the related keywords to instantly find all titles and app store descriptions that include them.
App Page History
App Store Optimization (ASO) is about changes and experiments designed to improve app visibility and performance. And our App Page History helps you track the respective evolution of app store pages over time.
Our system provides a reliable history of various app metadata, with full functionality gradually rolled out throughout 2024. Subtitle data has been available since mid-February 2024, information on localization languages since early February, icon tracking since April, and screenshots since June. While some data would have been collected even earlier, you can rely on complete historical records starting from these dates.
Ad Intelligence
To collect information about ad creatives and their impression estimates, we use multiple data sources, including ad transparency libraries, app metadata, and in-app ads data shared by publishers, as well as various sources of data on ad delivery volumes across different ad networks, countries, and platforms.
LiveOps & Updates Calendar
Our LiveOps & Updates Calendar is a comprehensive library of events featuring over 100 top-performing Casual, Midcore, and Hybridcasual games. All games are tracked, and all events are tagged manually. The events are reviewed by our experts, providing you with our own detailed data and unique insights.
Our gaming analysts play these titles daily to keep the calendar accurate and up to date. Once the event screenshots and descriptions are produced, our experts add comments on event specifics, its reskins, and which other games have implemented similar features.
The calendar also connects events with performance data, showing changes in revenue or downloads that occurred simultaneously. Using historical trends and seasonality, we build forecasts and compare them with actual figures. If they exceed the forecast estimates by more than 5%, the system flags it as an anomaly and shows the exact percentage increase, helping you quickly spot impactful events.
LiveOps Advanced Search
This tool enables you to quickly filter and search for events across multiple games, using customizable tags and time periods to focus on what matters most. You can also search by any keyword in event titles, descriptions, or expert reviews to find events with specific themes—even when no tag is assigned.