How Our Metrics for Steam Analytics Work
An overview of our Steam Analytics’ core metrics and the methodology behind them.
— Victoria Beliaeva

We present Steam data using two methods: a simplified estimation model and our advanced proprietary algorithm.
For the period prior to January 1, 2025, a simplified estimation approach was applied due to inherent limitations in historical data availability. Some data signals now utilized by our advanced model were not tracked or accessible for earlier timeframes. As a result, estimates from this period should be viewed as indicative rather than precise.
Starting from January 1, 2025, our proprietary system runs on a comprehensive suite of data signals and sophisticated algorithms to generate highly accurate estimates.
At its core, our model is built on Steam’s publicly available data and processes key metrics such as:
- App metadata and pricing (with regional tiers)
- Top Grossing chart positions
- Concurrent User numbers (CCU)
- Review volumes and sentiment
- Follower and wishlist stats
- Bundles, DLCs, and related elements
By scaling the monitoring of these signals, we capture both structural long-term patterns and short-term fluctuations. The first step is to collect the full range of Steam’s public data; at the same time, we interpret the meaning of each signal and map out Steam’s logic.
Parallel to this, we leverage access to Steam’s extensive user data, which lets us sample random profiles and monitor selected libraries. We identify when and which new games are added to libraries and calculate figures such as DAU, MAU, retention, and others.
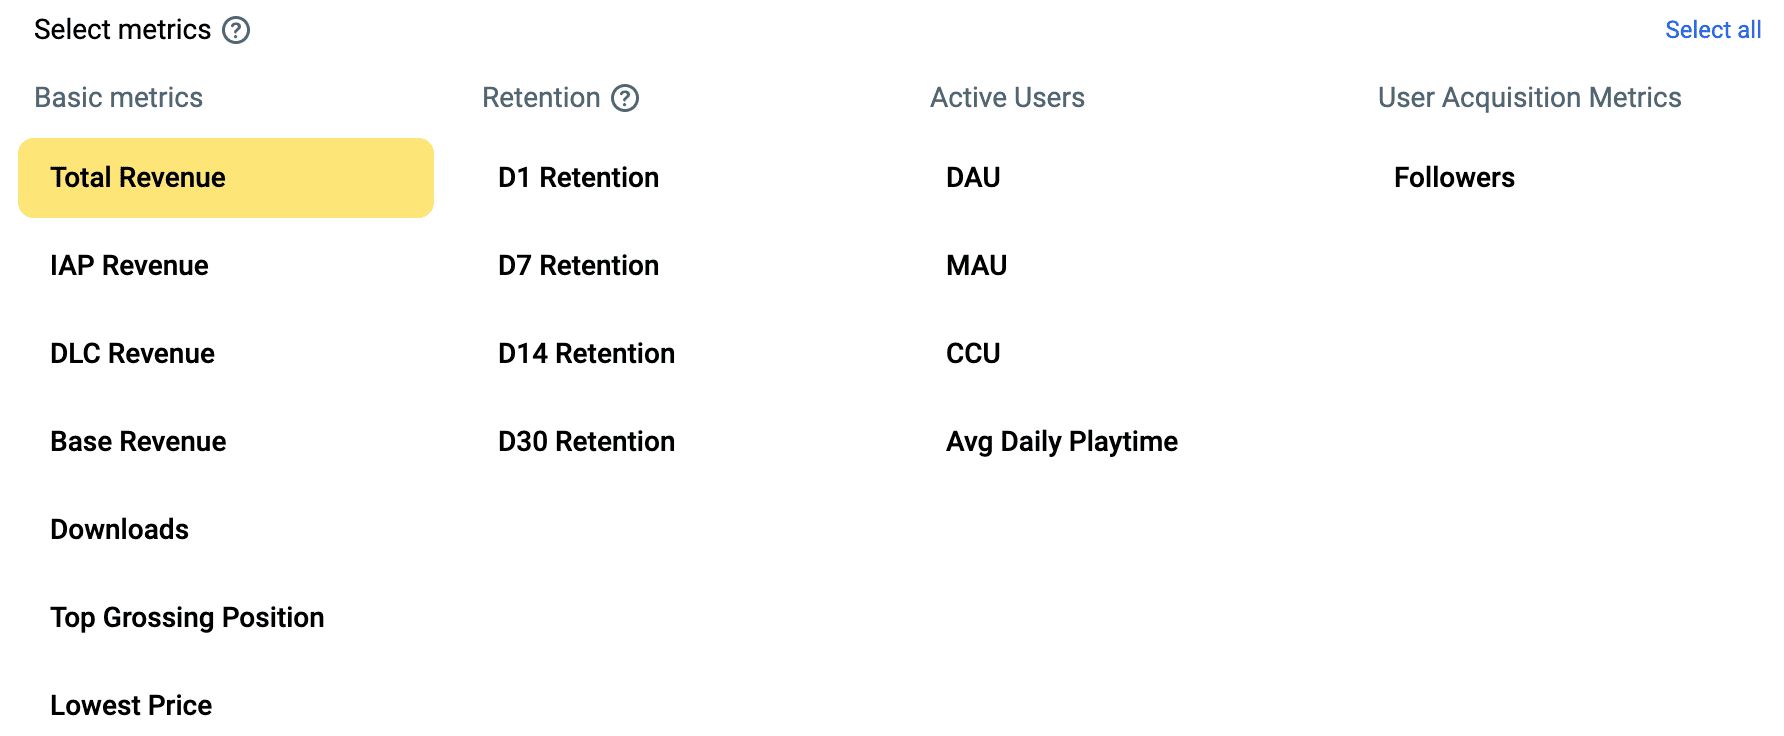
We align marketplace ranking dynamics with patterns observed across selected user activity and complementary financial signals. This layered perspective enables us to form a holistic view of how different forms of monetization interact—whether through direct purchases, add-on content, or ongoing in-app spending—without isolating any single mechanism as definitive. The result is a revenue-ranking model that feeds back into more precise downloads and revenue figures.
Once refined, we layer on monetization analysis—disaggregating free-to-play earnings, estimating DLC revenue, and distinguishing between base-game and add-on content performance. At every turn, the model cross-validates against alternative Steam data sources: different top-grossing chart slices, CCU trends, and various game features. It iterates continuously, minimizing error and strengthening internal consistency.
The system never adopts a single viewpoint. Instead, it dynamically cross-checks chart-based projections with real activity signals and self-recalibrates when discrepancies emerge. The final output is a reliable game-level dataset, comprising real-time estimates of downloads, revenue, and monetization behavior, meticulously built and disciplined by data.
Metric availability by year:
- Data on Revenue and Copies Sold is available starting from 2015
- DAU, MAU, and Retention metrics are available starting from 2025
- Wishlist metrics are available starting from June 2025
- Pricing data is available starting from 2025
- Review data is available starting from 2015
- Follower data is available starting from July 17, 2025
We’ll be happy to get your feedback at [email protected]